IDA Agent
The IDA Agent (Internal Diligence Agent) is the surveillance layer of the DEUSS ecosystem. It observes the marketplace continuously, independently of the applications that operate it, and turns raw blockchain activity into a reviewable stream of compliance findings. Where the Backoffice gives administrators the controls to intervene, IDA is what tells them that an intervention may be needed.
The agent is deliberately positioned as an observer. It consumes the decoded events that the DEUSS contracts emit, evaluates them against a layered set of detection rules and statistical models, and raises alerts for human review. It never issues transactions, never holds keys, and never blocks a trade on its own. Every finding is a recommendation addressed to a compliance officer, which keeps the accountability for any market intervention with a person, as the regulatory framework requires.
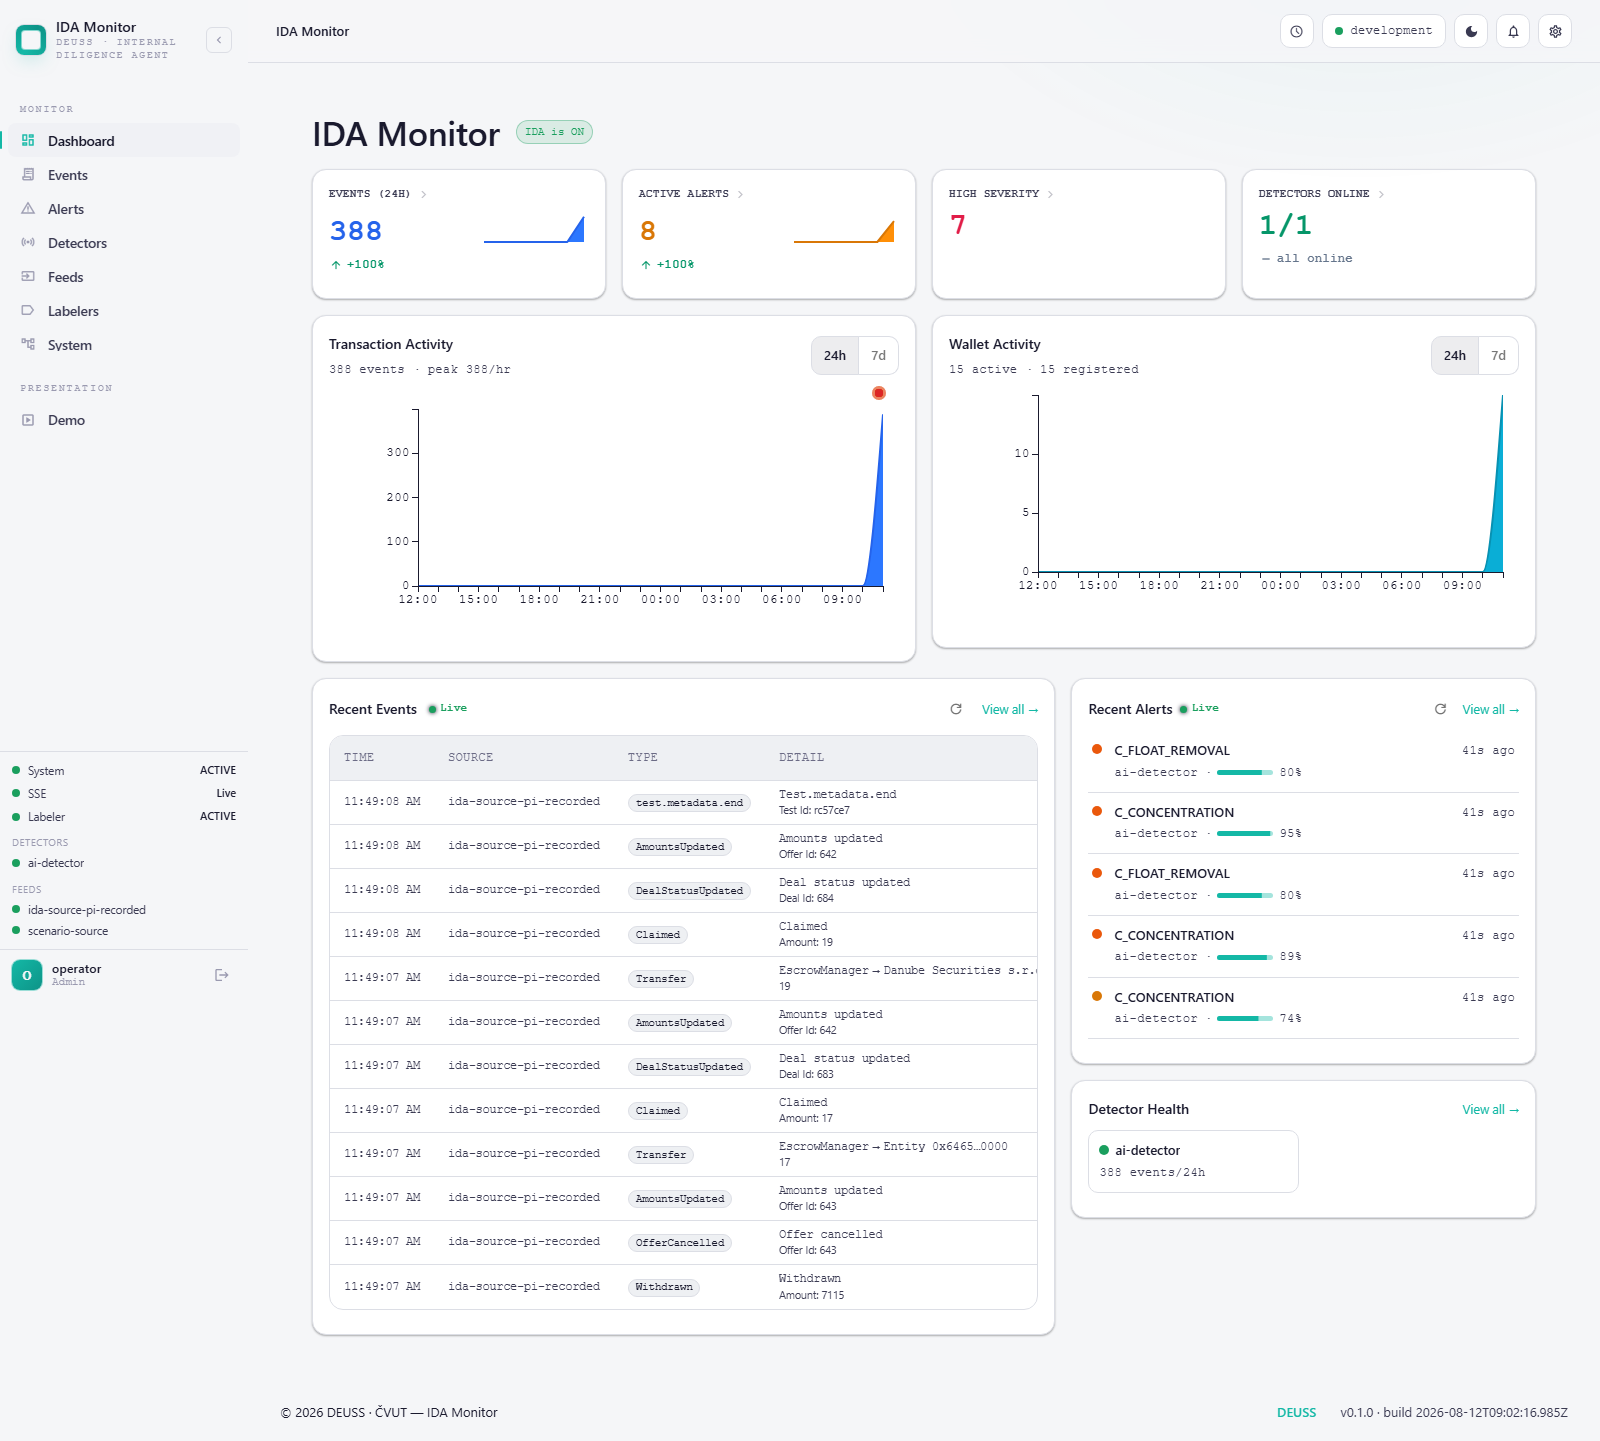
Operators work in the IDA Monitor, the console shown above. It answers the first question of any surveillance shift in a single view: what the market did, what the agent found in it, and whether the agent itself is healthy.
What IDA Watches
IDA reads the on-chain activity of the marketplace as it happens. Each event is decoded from the DEUSS contracts, normalised into a common shape, and stamped with two distinct times: when the event actually occurred on chain, and when IDA received it. That distinction matters for surveillance, because a delayed or replayed stream must never be mistaken for a burst of live activity.
The captured activity is grouped into four domains that mirror how the platform behaves:
- Trading, covering offers, counter-offers, executions and settlement.
- Wallet Actions, covering transfers, balances and custody operations.
- Registry, covering entity registration, bond registration and publication.
- Governance, covering role grants, permission changes and protocol-level administration.
Alongside the chain, IDA accepts events from external producers over an authenticated feed interface, so off-chain signals from partner systems can be correlated with on-chain behaviour without changing the platform itself.
From Events to Alerts
Detection runs in layers, each answering a different question about the same event stream. Hard rules catch what is plainly not allowed, such as tokens minted by an address that holds no issuer role, or a bond issued without a prior publication. Statistical models catch what is unusual for the market rather than forbidden by it. Graph analysis catches structure that is invisible in any single transaction, such as a closed loop of transfers that returns an asset to its origin, or a fan-out pattern that splits a position across freshly created wallets. A market microstructure layer looks at timing and price formation, where cornering, coordinated waves and manipulated marks become visible only in the relationship between trades.
Every alert carries a severity of critical, high, medium or low, and a detection confidence expressed as a percentage, so an operator can distinguish a certain but minor finding from an uncertain but serious one. Alerts are also placed on a deliberate escalation ladder that separates machine judgement from human judgement:
- Anomaly, meaning non-standard behaviour identified by the detection engines.
- Suspicious, meaning behaviour that a human reviewer has assessed as undesirable.
- Potential Abuse, meaning a case that may constitute market abuse under MAR and warrants escalation.
Only the first step is automatic. Moving a finding up the ladder is an act performed by a compliance officer and recorded as such.
The IDA Monitor Console
Headline indicators report the events processed in the last 24 hours, the number of alerts still open, how many of them are high severity, and how many detection modules are online. Activity charts place alert markers over transaction volume, so a spike in findings can immediately be read against the market conditions that produced it. Live panels stream recent events and recent alerts as they arrive, and a health strip reports whether every detector and every feed is actually running.
Because addresses are meaningless to a reviewer, IDA resolves on-chain identifiers to their real-world counterparts wherever it can. Wallets are presented under the entity that owns them, bonds under their issuer and publisher. The underlying event is never rewritten; the names are an overlay applied when the data is read, which preserves the integrity of the recorded evidence.
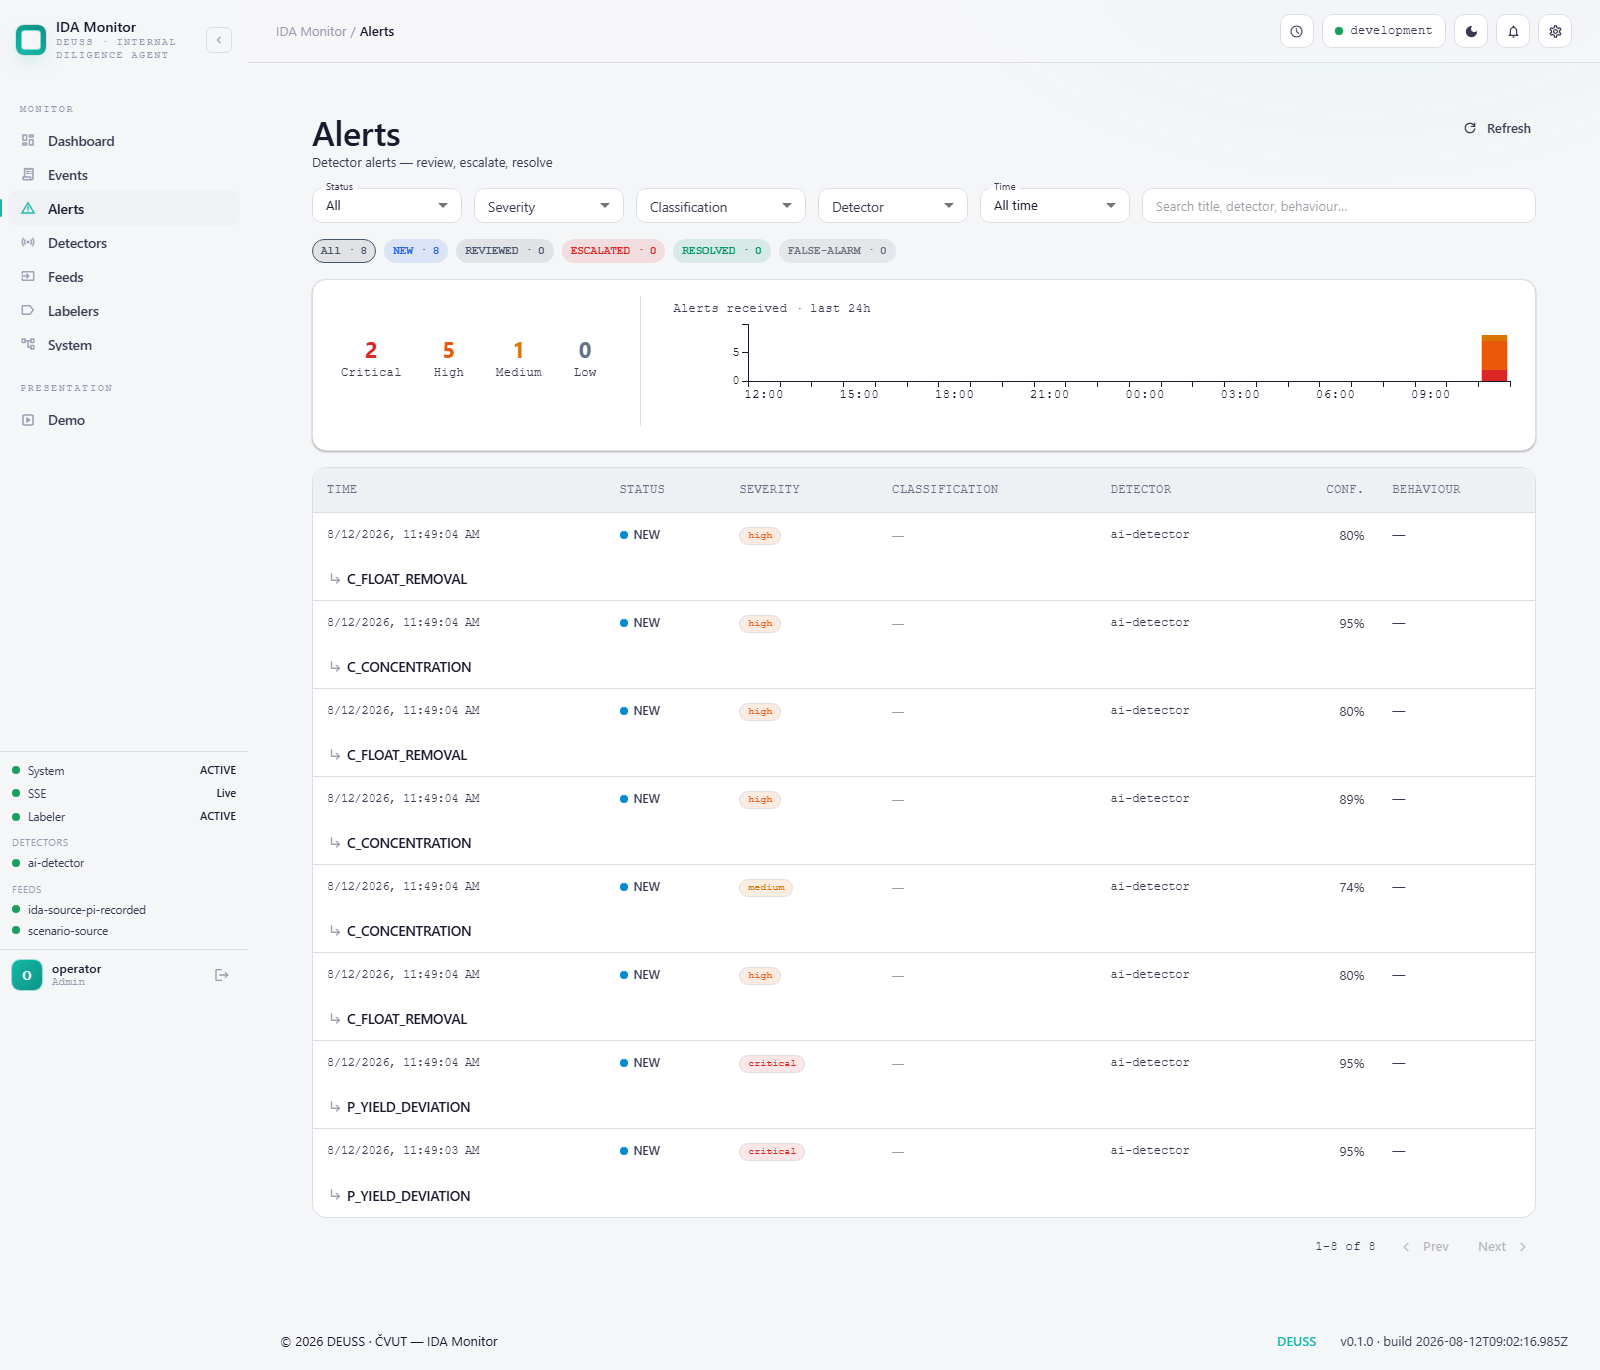
The alert queue is the working surface of the console. Findings can be narrowed by severity, status, classification and detector, and the severity tiles and the daily histogram give the shift a quick sense of how much genuinely needs attention.
Reviewing an Alert
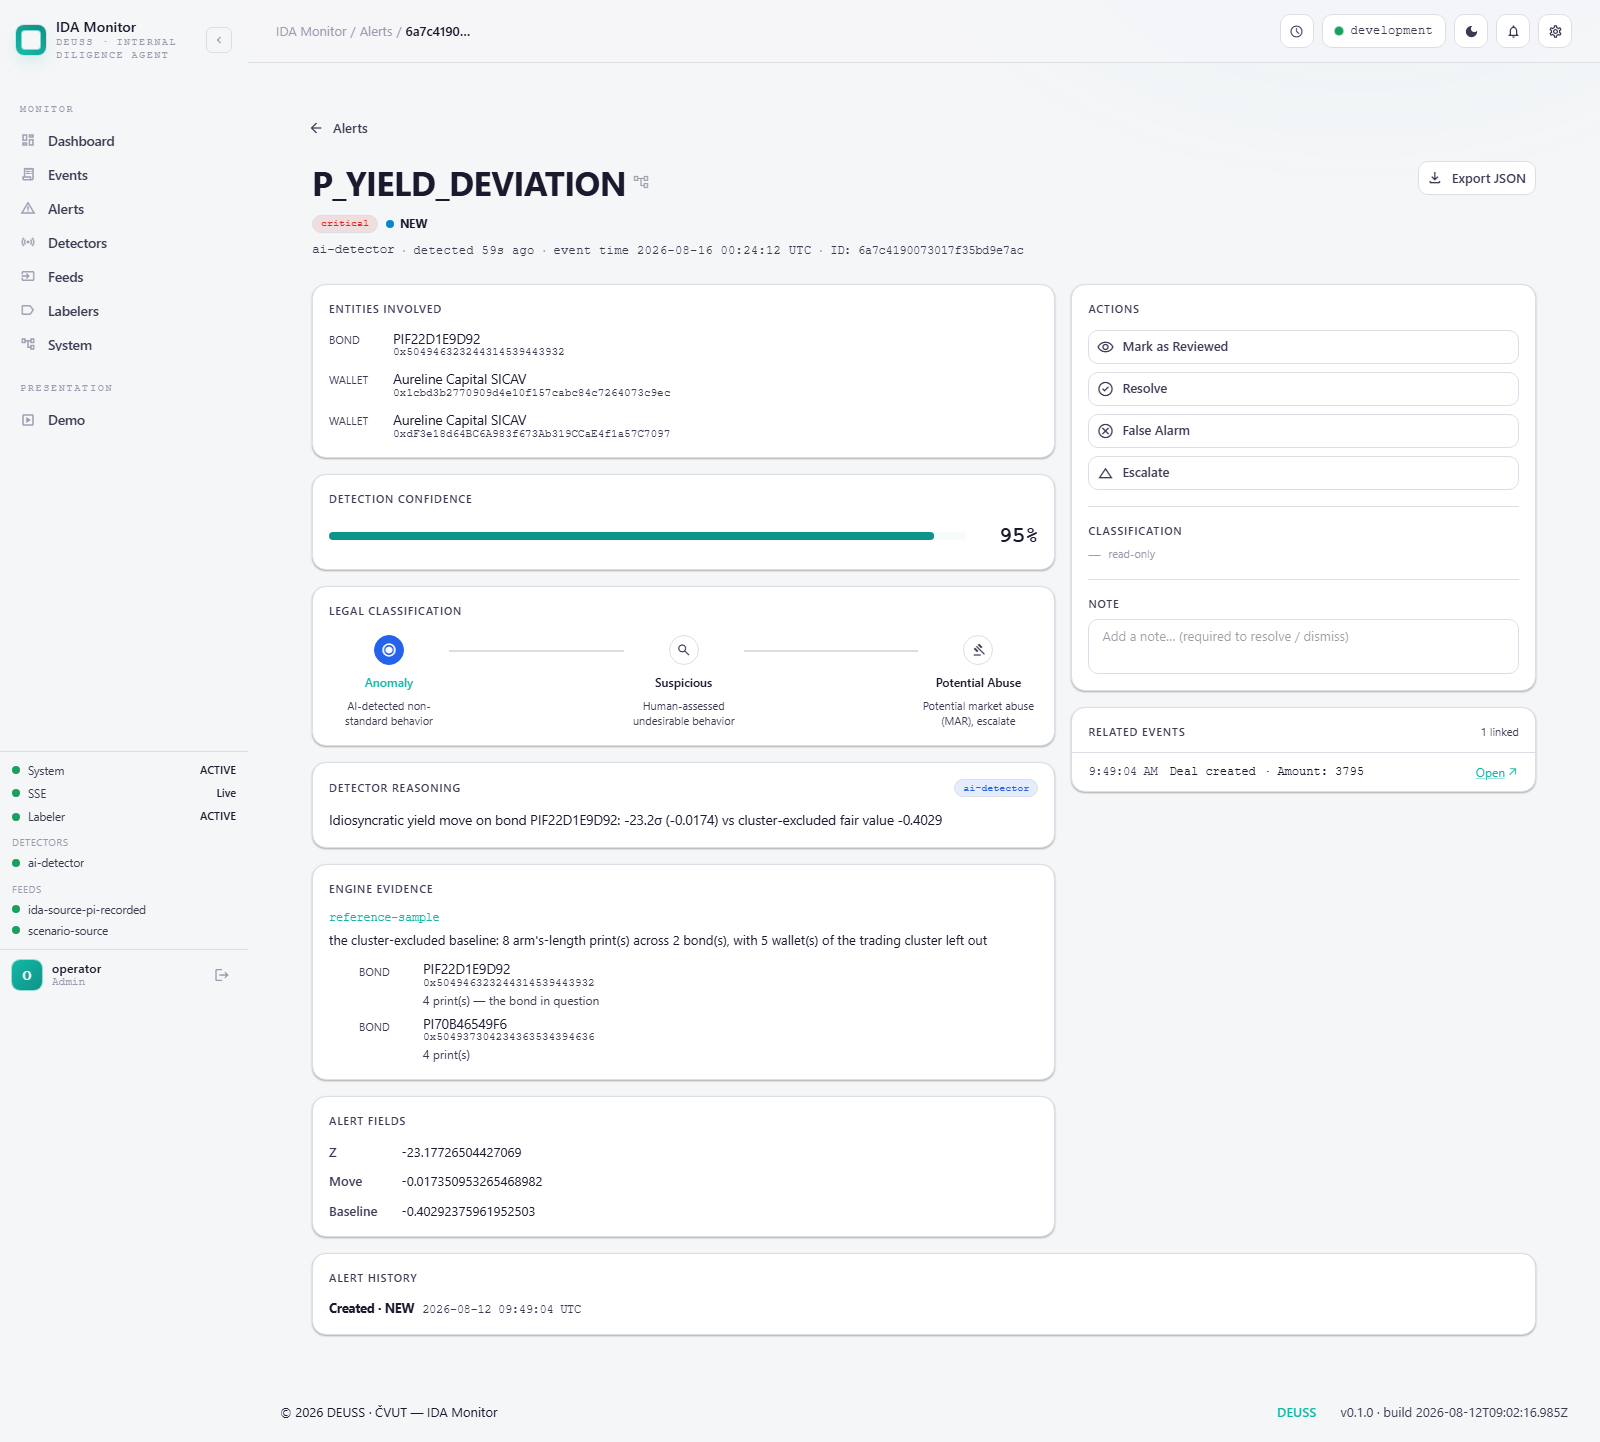
Each alert opens into a case view built for a compliance workflow rather than for debugging. It names the entities involved, states the detection confidence, presents the evidence the engine relied on, and lists the events that triggered it, each one linked back to the full record.
Reviewers move an alert through the NEW, REVIEWED, ESCALATED, RESOLVED and FALSE-ALARM statuses using the "Mark as Reviewed", "Escalate", "Resolve" and "False Alarm" actions. Closing a case, whether by resolving it or dismissing it, requires a written note, so no finding disappears without a stated reason. Every status change is retained as an audit trail on the alert itself, and the complete case can be exported as JSON for a case file or for a regulator.
Detector Transparency
Surveillance systems are only credible if their reach can be stated precisely. Each detection module therefore publishes a machine-readable description of what it is capable of, which the console renders as a browsable hierarchy of detection layers, the engines within them, and the individual alert types each engine can raise. Every alert type documents what it means and the conditions under which it fires, and modules that are configured off are shown as such rather than silently omitted.
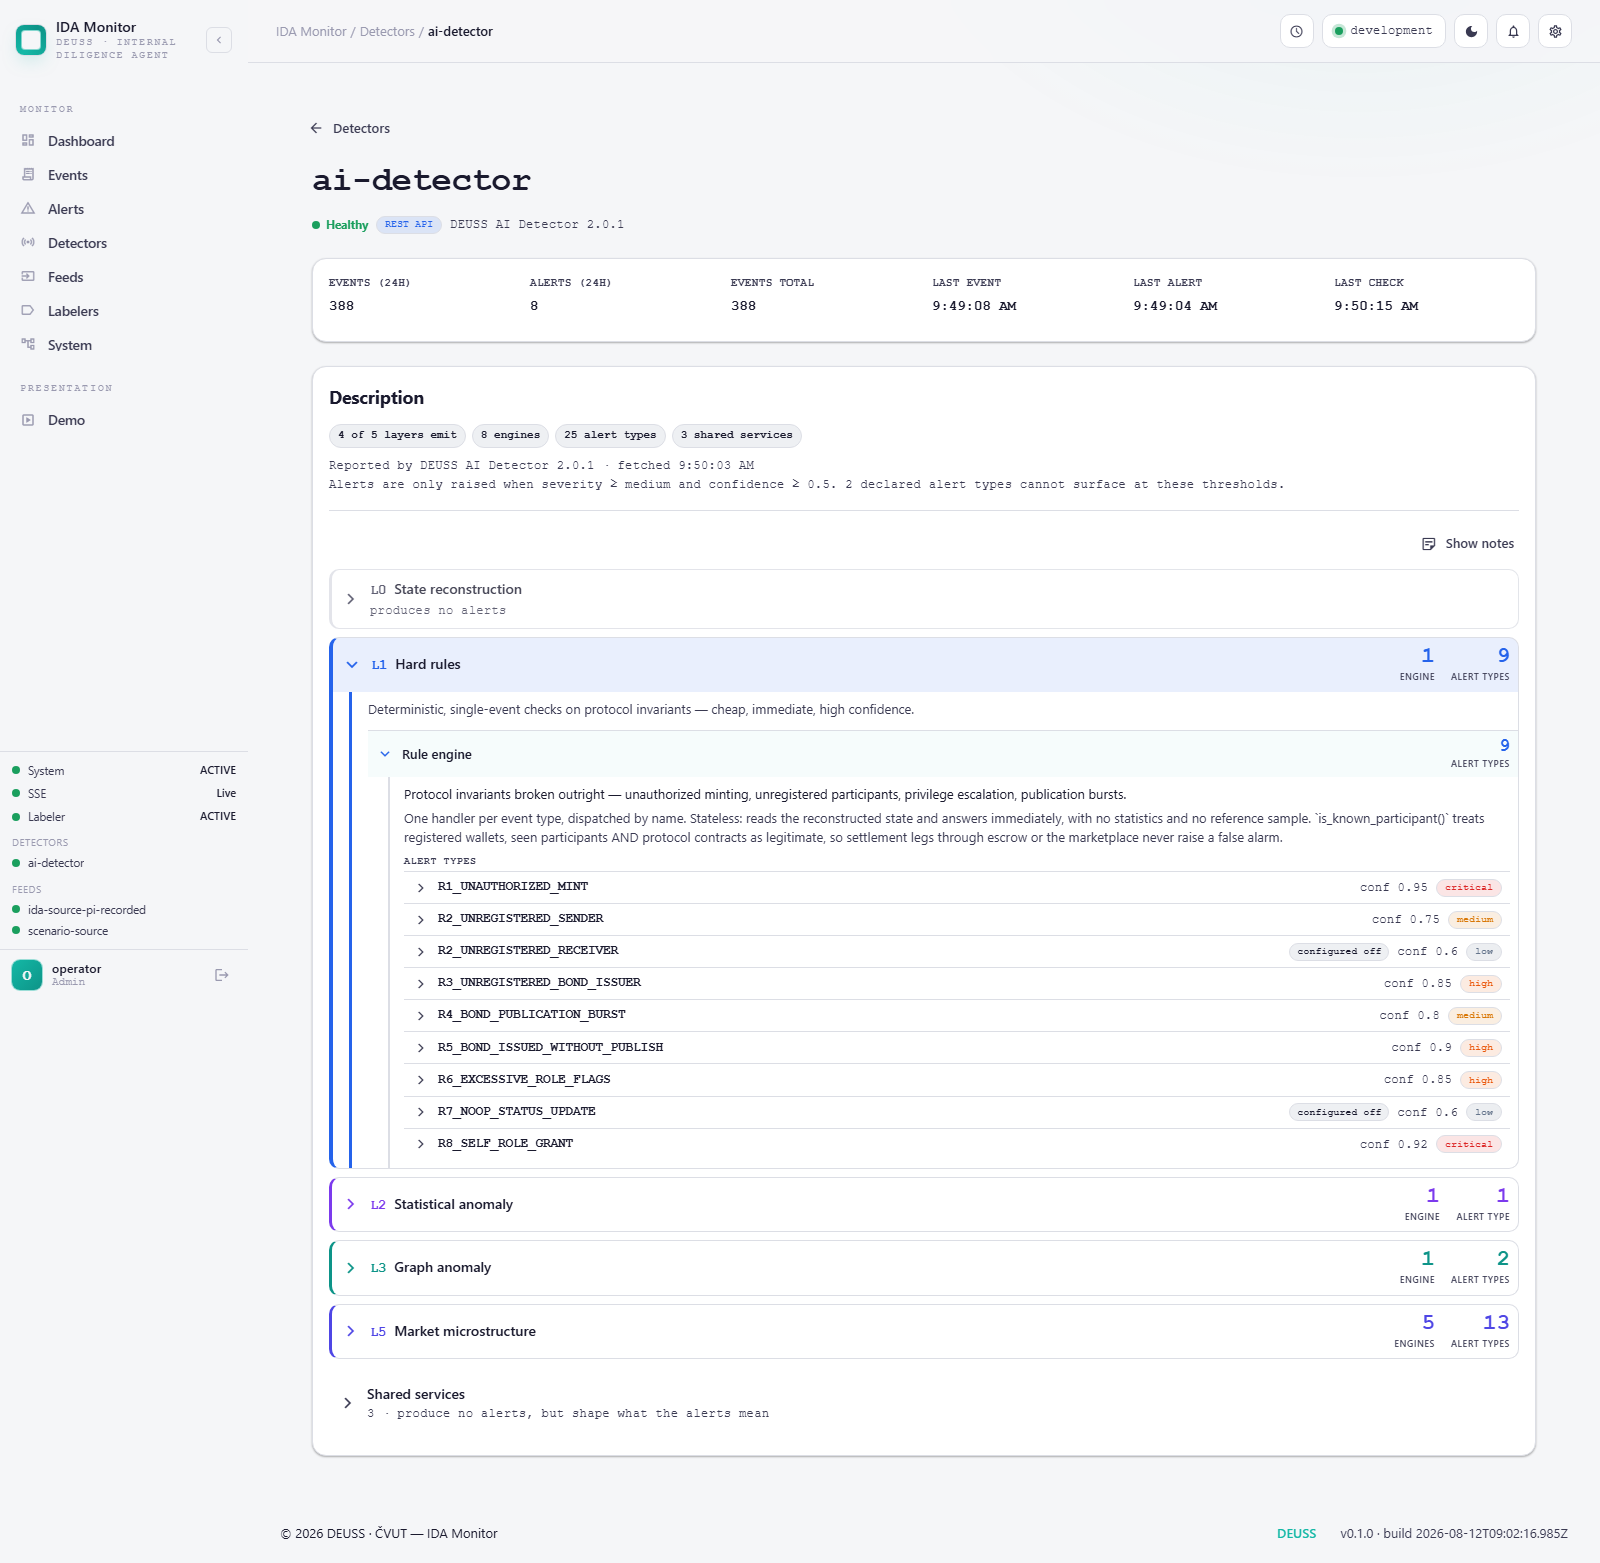
This makes the coverage of the platform auditable in the same way its transactions are. A reviewer confronted with an alert can trace it to the exact rule that produced it, and an auditor asking what the platform does not monitor can be given an answer taken from the running system rather than from documentation that may have drifted.
Architecture and Integration describes the components, the event pipeline, the detector interface and its capability manifest, the full catalogue of alert types, and the REST and streaming API.